Description
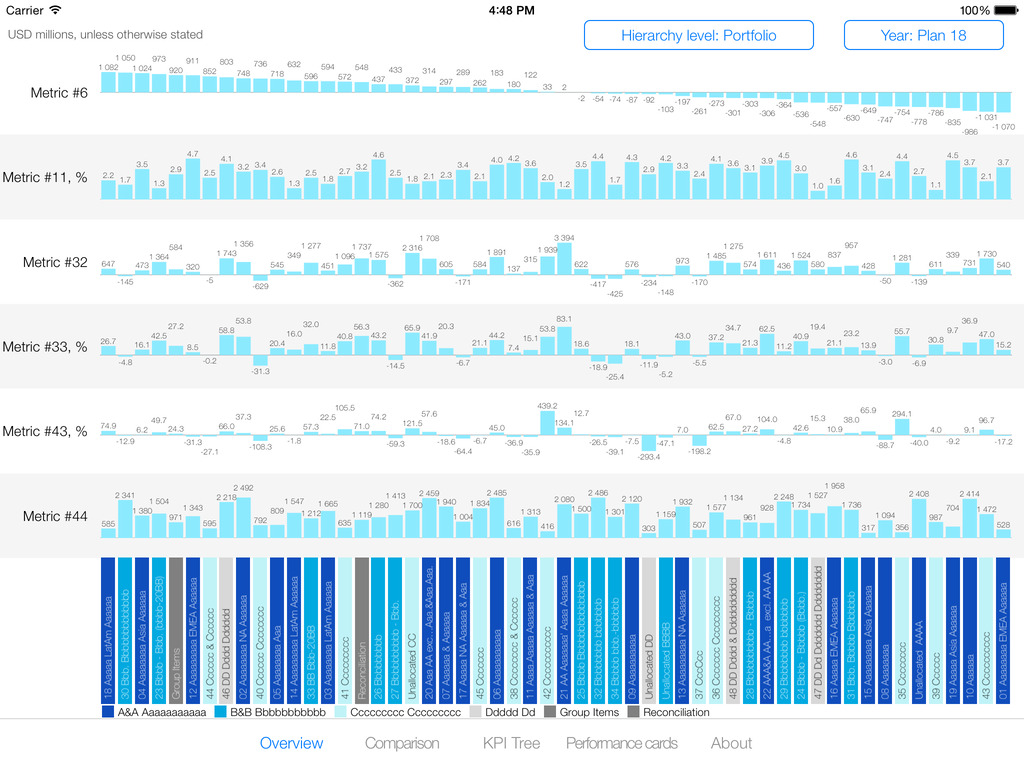
An internal app for a large consulting agency. Used by company top managers for presentations and to analyse investition metrics.
Data is uploaded to the app manually via iTunes (to ensure 100% privacy for very sensitive data).
When
October 2015
App features
- Swift 2.0, iOS 8.0+
- An iPad app with auto layout, works both on iPad and iPad Pro
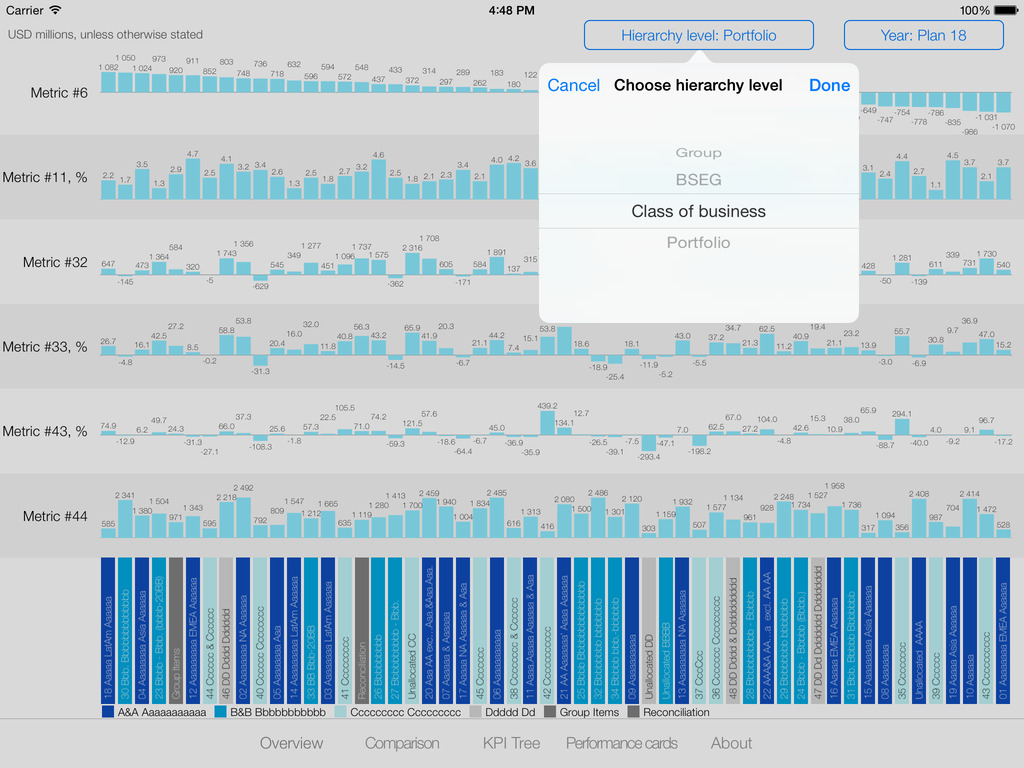
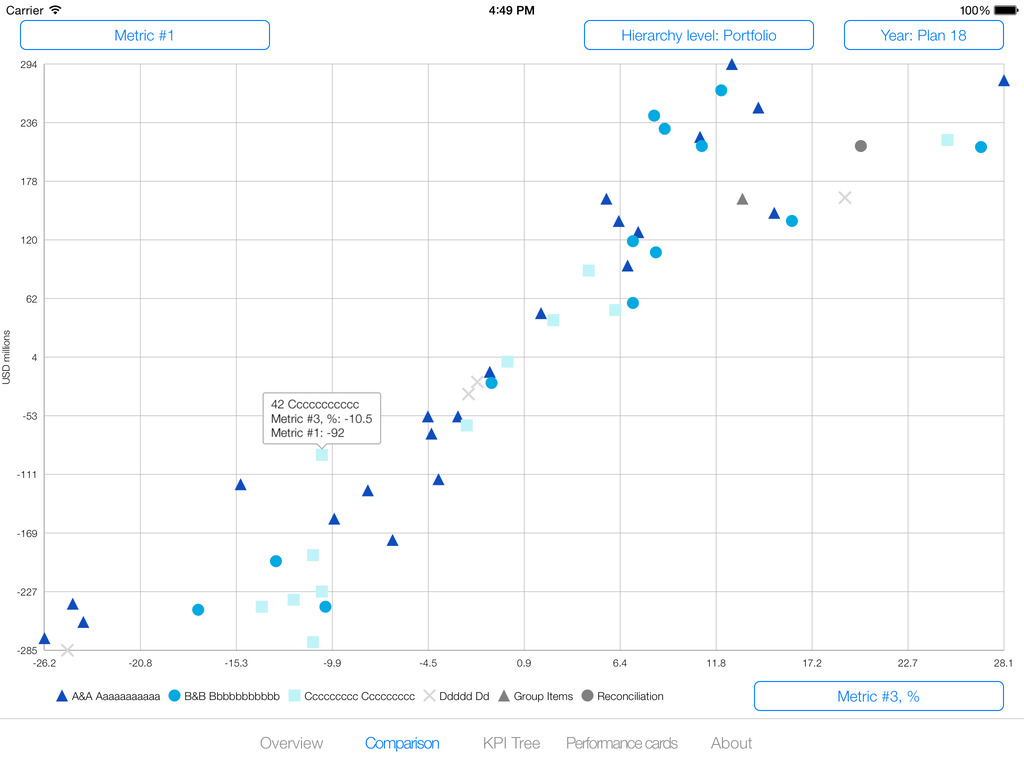
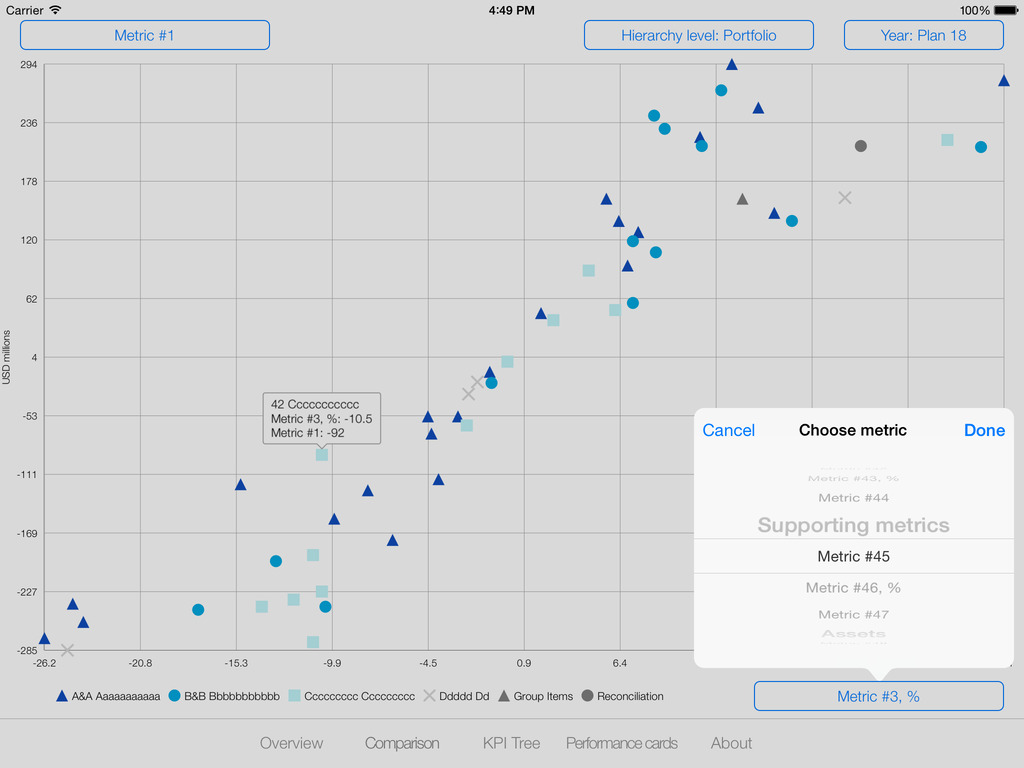
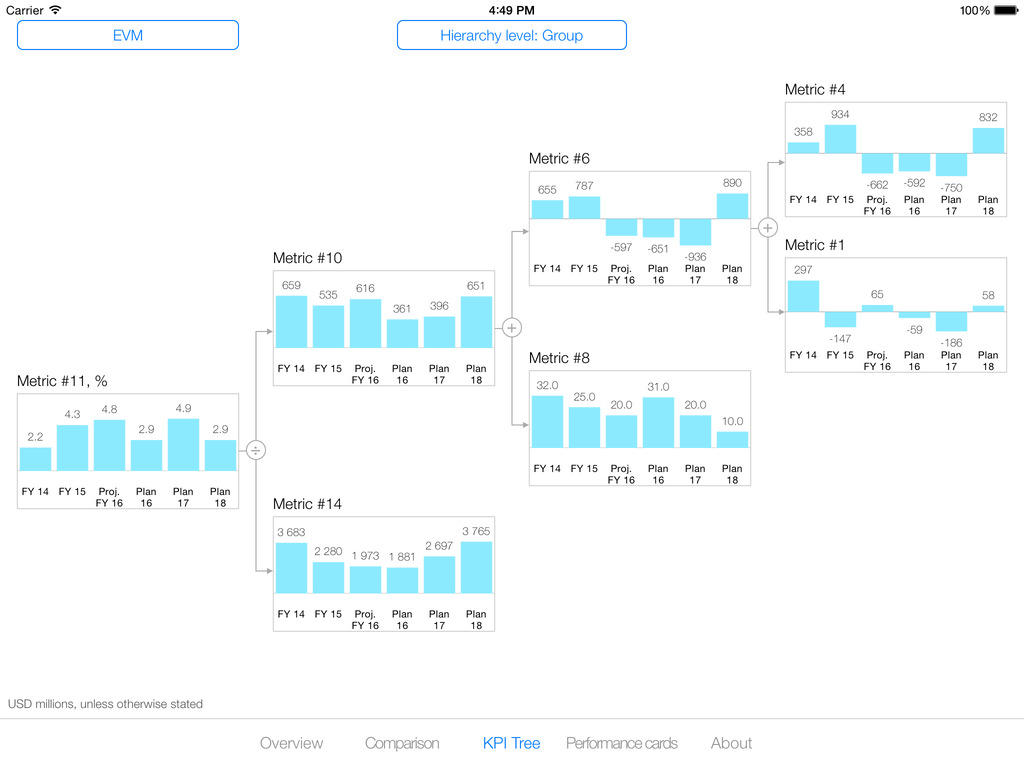
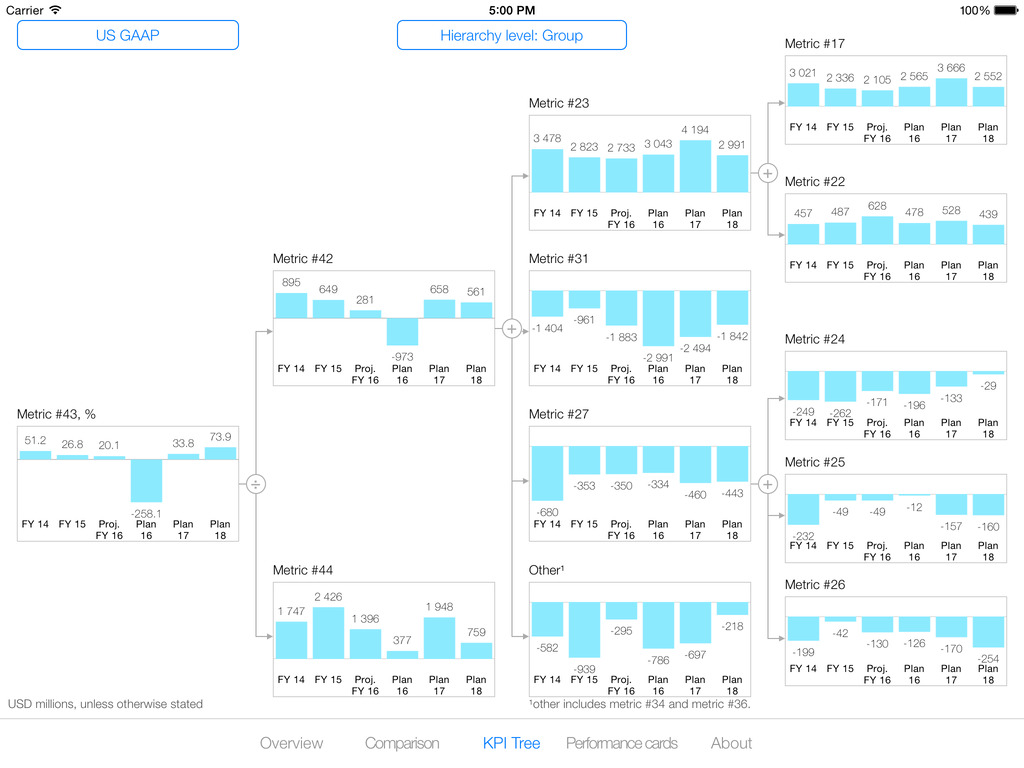
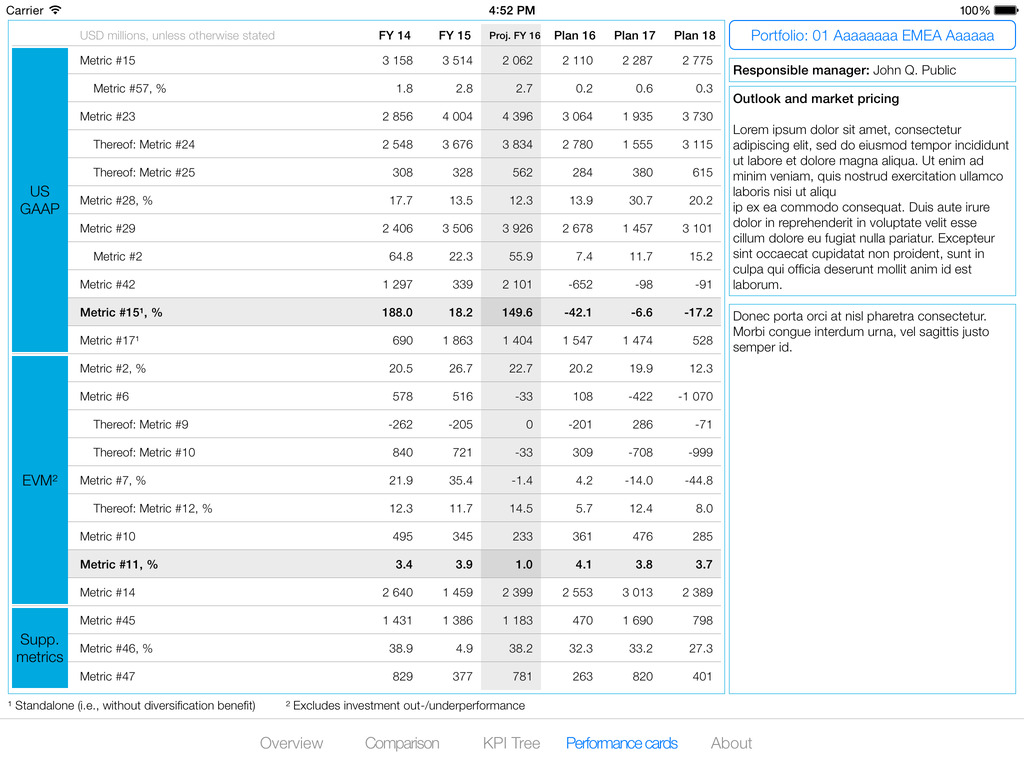
- Aggregate data (by year, by company, by metric), show different graphs (scatter plot, charts, data grid)
- Protect app with pin code. Blur app screenshot in iOS task manager.
- Charts & SwiftCharts libraries to draw different kinds of charts.
- No 3rd party services were used to keep sensitive data as private as possible.
My role in project
I was sole developer on the project.


